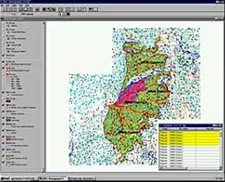
Thematic Mapping
 Various types of thematic maps can be created. These themes can be assigned meaningful colors and the legend control can be used to see the legend of the themes created. Thematic mapping refers to the creation of maps, which emphasize specific characteristics of a given geographic area. Thematic maps are particularly well suited for presenting complex information in an understandable format. Making complex information understandable is a primary purpose of any map geared toward the general public.
Different types of Themes that can be created are as follows:
Ranges
The ranges theme divides the data on the basis of number of ranges defined. The user can specify the colors to be used with each particular range unit.
This ranging is based on one of the following techniques:
- Equal Ranges: The entire range is divided into equal spaced sections and the theme is created on the basis of it
- Equal Count: The total numbers of units, which are being considered for creating the theme, are divided into equal sized groups and the theme is generated on the basis of that.
- Quantile: The entire data set is divided into quantile groups and the ranging is done on the basis of it.
- Graphs: Thematic maps in the form of bar graph and pie charts can be created.
- Bar Graph
- On specifying the Graph theme type to bar chart the theme generator creates
bars corresponding to each specified field of theme creation.
- Pie Charts
On specifying the chart theme type to pie chart the theme generator creates a pie with each specified field forming a part of the pie. This kind of theme is generally used when comparing values and observing the amount of share each field has in the entire group.
- Individual
The individual theme is used to create themes where each individual value is given a unique color. This kind of thematic maps are used when mapping a large dataset and trying to find out similar values.
- Graduated
Themes are created on the basis of a single symbol as selected by the user and representing it in various sizes to represent the corresponding value.
- Dot Density
Themes are created in the form of collection of dots where each dot represents a certain value the numbers of dots gives an idea of the population of the value being represented.


